Discovering iOS Memory Leaks IV: Detecting via Unit Tests

Context
In the third part, while automating memory leak detection on GitHub Actions using Maestro, I ran into a few problems with the overall workflow. For context, this series builds on:
- Discovering iOS memory leaks: A case study with Firefox app
- Discovering iOS memory leaks: A case study with Firefox app II
- Discovering iOS memory leaks III: Automating with Github Action
First, the feedback cycle was painfully slow. That’s not a tooling issue as much as it’s the nature of UI tests themselves. You need to boot a simulator, launch the app, navigate through flows, and only then do you get a report. When you’re iterating on leaks, this quickly becomes a bottleneck.
Second, not every team has end-to-end or UI tests in place. And even when they do, those tests usually cover only the happy paths or a few critical flows. Asking teams to introduce UI tests purely for leak detection felt like a big ask and maintenance, especially when leaks can exist outside those flows.
While thinking about this, I kept coming back to how memory works on iOS. Allocation and deallocation are driven by reference counting and are largely independent of the view lifecycle, unlike Android where view lifecycle boundaries play a much stronger role.
That raised an obvious question for me: can we detect memory leaks using unit tests?
If that works, the advantages are pretty clear. Almost every team already has unit tests. Coverage would increase automatically, without requiring full end-to-end orchestration. And most importantly, the feedback loop would be much faster since we’re not spinning up the entire app just to answer one question: did this object leak or not?
Is it even Possible? An Example
To answer whether unit tests can realistically catch memory leaks, it helps to step back and look at what actually happens when a unit test runs.
When you execute a unit test:
- Xcode or
xcodebuildlaunches the iOS simulator - The Firefox iOS app is launched
- Unit Test setup runs, followed by execution and teardown
All of this happens inside the context of the iOS simulator. What we want to do is simple in theory: at the end of a unit test, or during teardown, run the leaks tool against the Firefox process and dump any detected leaks.
If we break this down further, the flow looks like this:
- Launch the simulator
- Launch the Firefox app
- Run the unit test setup and execution
- During teardown, invoke
leaksfor the Firefox process
The command we need for this is:
xcrun simctl spawn booted leaks ClientInvoking leaks command
This runs the leaks tool directly inside the simulator. At this point, the remaining problem is automation.
We can’t invoke Process APIs directly from a unit test because the test code runs inside the iOS framework. There’s no supported way to spawn external processes from there. To get around this, the approach is to introduce a very small HTTP server running on the host. This server’s only responsibility is to execute the leaks command when asked.
So, at high level here are the steps for automation:
- Creating HTTP server on host invoking leaks command on Firefox app
- An extension of XCTestCase to ping HTTP server
- Running
xcodebuildcommand to get the leaks report and test output
HTTP Server: Invoking Leaks on Simulator
To make this work in practice, I wrote a very small HTTP server using Ktor. There’s nothing fancy here. The server exists purely to act as a bridge between the unit test and the host machine.
At a high level, the unit test calls an HTTP endpoint, and the server invokes the leaks tool inside the simulator.
This is what the server looks like:
embeddedServer(Netty, port = 8080) {
   routing {
     get("/leaks") {
       val (exitCode, output) = runLeaksCommand("Client")
       if (exitCode == 0) {
         // no leaks
       } else {
         // consume leaks output here
         call.respondText("leaks exited with code $exitCode\n\n$output")
       }
     }
   }
}
HTTP Server for invoking leaks command
The server exposes a single endpoint. When /leaks is hit, it runs the leaks tool against the Firefox process and returns the output.
The actual invocation happens in runLeaksCommand, which is just a thin wrapper around xcrun:
suspend fun runLeaksCommand(vararg args: String): Pair<Int, String> {
    return withContext(Dispatchers.IO) {
        val process = ProcessBuilder(
            listOf("xcrun", "simctl", "spawn", "booted", "leaks", *args)
        ).redirectErrorStream(true) // merge stderr into stdout
          .start()

        val output = process.inputStream
            .bufferedReader()
            .use(BufferedReader::readText)

        val exitCode = process.waitFor()

        exitCode to output
    }
}
Invoking leaks command
This runs leaks inside the currently booted simulator, captures the full output, and returns both the exit code and the raw text. Next step would be to ping this server on tear down.
LeaksReportingTests: Invoking the server
On the test side, the integration is intentionally minimal. All we need is a hook that runs at the very end of a test’s lifecycle and triggers the leak dump.
For that, I created a dedicated XCTestCase that overrides tearDown and pings the HTTP server we set up earlier.
class LeaksReportingTests: XCTestCase {

    override func tearDown() {
        // Call leaks BEFORE the test finishes
        pingLeaksEndpoint(from: self)

        super.tearDown()
    }

  func pingLeaksEndpoint(
    from testCase: XCTestCase,
    url: URL = URL(string: "http://localhost:8080/leaks")!,
    timeout: TimeInterval = 10.0,
    file: StaticString = #filePath,
    line: UInt = #line
  ) {
    // http call to the url
  }
}
Invoking leaks command
The important detail here is timing. The leak check needs to happen before the test process fully exits, while the app and its objects are still alive in memory. tearDown gives us exactly that window.
The test itself doesn’t know anything about simulators or leaks. It just makes an HTTP request. If leaks are found, the server responds with the output, which can then be surfaced as a test failure or logged for further inspection.
Real Sample from FormAutofillHelperTests
At this point we have the plumbing in place: unit test teardown pings the host HTTP server, the server runs leaks inside the simulator, and we get the report back in the test output.
Now let’s prove this actually works with a real example.
The idea is simple. We’ll add a test-only helper method in FormAutofillHelper that intentionally creates a retain cycle, then we’ll write a unit test that triggers it and we'll verify if we see the retain cycle and leaks output in XCode while running test.
Intentional leak
This extension creates a true retain cycle:
self → foundFieldValues → box → self
extension FormAutofillHelper {
    /// Creates a true retain cycle:
    /// self → foundFieldValues → helperBox → self
    func createIntentionalRetainCycleForTests() {
        final class HelperBox {
            var helper: FormAutofillHelper?
        }

        let box = HelperBox()
        box.helper = self

        foundFieldValues = { _, _, _ in
            // Closure retains `box`
            // box retains `self`
            _ = box.helper
        }
    }
}
Intentional Retain Cycle
Now let's write a test that invokes this method and try running this from Xcode:
@MainActor
final class FormAutofillHelperTests: LeaksReportingTests {
  func testFormAutofillHelperLeaksWithRetainCycle() {
    weak var weakHelper: FormAutofillHelper?

    autoreleasepool {
      let tab = Tab(profile: profile, windowUUID: windowUUID)
      let helper = FormAutofillHelper(tab: tab)

      helper.createIntentionalRetainCycleForTests()

      weakHelper = helper
    }

    XCTAssertNotNil(
      weakHelper,
      "FormAutofillHelper should leak due to retain cycle via foundFieldValues"
        )
    }
}
XCTest case with intentional leak
And bam! you'll see that it actually works!!! Here is the output:
Test Suite 'ClientTests.xctest' started at 2025-12-30 09:22:11.779.
Test Suite 'FormAutofillHelperTests' started at 2025-12-30 09:22:11.779.
Test Case '-[ClientTests.FormAutofillHelperTests testFormAutofillHelperLeaksWithRetainCycle]' started.
2025-12-30 09:22:11.798 💙 INFO [remoteSettings] SearchEnginesManager - [SEC] Search engine provider: MockSearchEngineProvider
Failed to resolve host network app id to config: bundleID: com.apple.WebKit.Networking instance ID: Optional([_EXExtensionInstanceIdentifier: DA7A2FF8-6A32-4C9E-BDFC-F5A87C65DD39])
WebContent[98505] 0x103058100 - [sessionID=1] WebProcess::updateFreezerStatus: isFreezable=1, error=-1

Leaks endpoint output:
leaks exited with code 1

leaks Report Version: 4.0
Process 98497: 71742 nodes malloced for 7979 KB
Process 98497: 4 leaks for 272 total leaked bytes.

    4 (272 bytes) ROOT CYCLE: <HelperBox #1 in FormAutofillHelper.createIntentionalRetainCycleForTests() 0x6000002a42a0> [32]
       3 (240 bytes) __strong helper --> ROOT CYCLE: <FormAutofillHelper 0x600002658fc0> [96]
          __strong foundFieldValues.context --> CYCLE BACK TO <HelperBox #1 in FormAutofillHelper.createIntentionalRetainCycleForTests() 0x6000002a42a0> [32]
          1 (112 bytes) logger --> <Closure context 0x600002948850> [112]
          1 (32 bytes) __strong _refcounts --> <Swift weak reference storage 0x6000002a42e0> [32]
XCTest case with intentional leak
Finding Real Memory Leak from unit tests
At this point, I got curious about how useful this workflow actually is. Can it point to real leaks?
To answer that, I enabled leak reporting across few tests from firefox ios repo inheriting from LeaksReportingTests, where teardown pings the server and triggers a leak dump.
Running the tests from:
xcodebuild test -project ./firefox-ios/Client.xcodeproj -scheme "Fennec" -destination "platform=iOS Simulator,OS=17.5,name=iPhone 15 Pro" > ~/Desktop/Workspace/leaks_out.txtWhat I saw initially wasn’t very surprising. A lot of reports pointed to leaks inside test code itself. Those are expected to some extent and usually not very useful. Tests are often sloppy with lifetimes, and fixing those doesn’t necessarily improve the app.
And bam! there are 3 tests in BrowserViewControllerTests that gave me retain cycles:
66 (8.70K) ROOT CYCLE: <DefaultTemporaryDocument 0x6000035782c0> [176]
   49 (7.28K) onDownload + 8 --> ROOT CYCLE: <Swift closure context 0x600001943280> [64]
       --> CYCLE BACK TO <DefaultTemporaryDocument 0x6000035782c0> [176]
      48 (7.22K) __strong  --> ROOT CYCLE: <MockTab 0x105eb9a50> [944]
         temporaryDocument --> CYCLE BACK TO <DefaultTemporaryDocument 0x6000035782c0> [176]
The important part here is the root cycle. DefaultTemporaryDocument is retaining a closure, and that closure is retaining the same document object.
When I traced it back to the code, the issue became obvious. The document was being strongly captured inside its own callback.
temporaryDocument = document
temporaryDocument?.download { url in
ensureMainThread { [weak self] in
guard let url else { return }
// strong document closure reference creating retain cycle
guard let sourceURL = document.sourceURL, document.sourceURL?.isFileURL == false else { return }
self?.temporaryDocumentsSession[url] = sourceURL
self?.documentLogger.registerDownloadFinish(url: sourceURL)
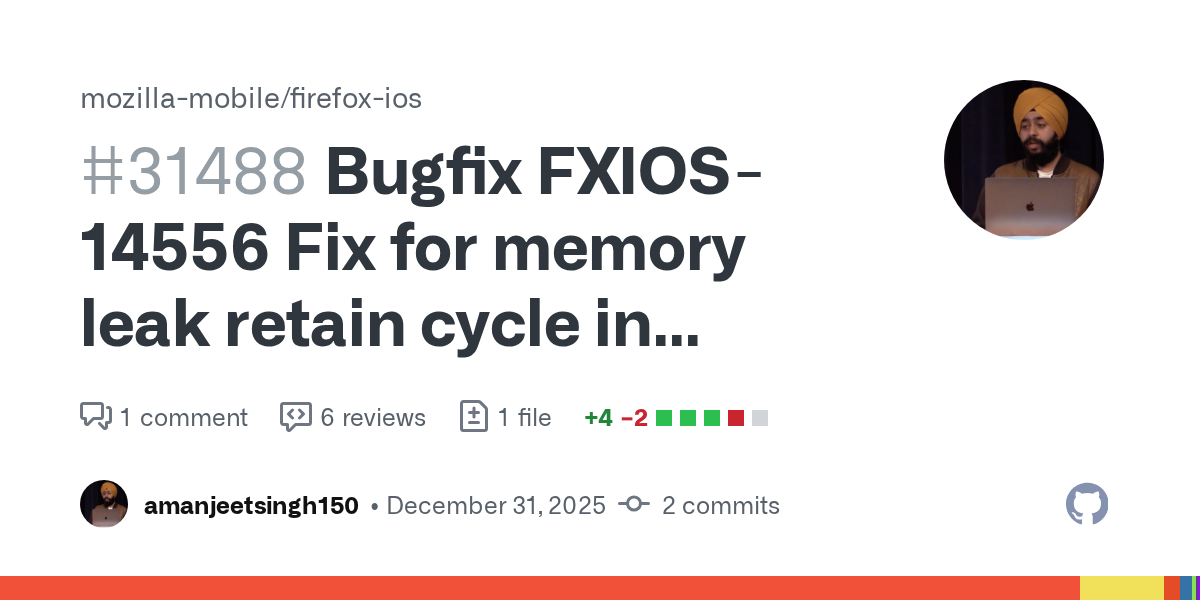
}I ended up creating an issue and a PR to fix this in the Firefox iOS repo. The PR is already approved and waiting to be merged 🤞
That was the moment where this approach stopped feeling like an experiment and started feeling genuinely useful.
Are you trying to solve leaks on your iOS app? I'd love to get in touch and share my learnings and methodology and see if we can make it work for other apps as well. Reach out to me at @droid_singh and let me know.