The Three Musketeers of time

Time is a very important attribute to track whenever you are facing performance issues. Understanding the different types of time is equally important for you to narrow down on the root cause of the performance issues. These performance issues can be related to a cold start, rendering time of a screen, or even battery drain.
There are broadly three types of time that you will need to track whenever you are facing these performance issues:
- Wall Clock time
- On CPU time
- Off CPU time
These different times are worth tracking at an interaction level which means at a particular user flow. This could be a cold start, rendering of the screen, etc.
In this post, we will discuss these different types of time, how they can be calculated on android and some interesting facts which I found while I was working with them.
Wall Clock time
Wall clock time is the total elapsed time for your interaction. You can describe this time at both the process and thread level. So, for a thread, this will include the time when your thread was on the CPU executing your code and also the time when it was waiting for some I/O or blocked by some lock or a synchronized resource. So, to put simply,
Wall Clock time = On CPU time + Wait time/Off CPU time
In Android, due to multiple clock APIs, there could be a confusion to select the right clock for tracking purpose from the perspective of performance. The key fundamental, in this case, is that the clock should be monotonically increasing which means it should only increase its values. SystemClock#uptimeMillis is one of the ideal options here. The famous System#currentTimeMillis can go both backward and forward and thus is not a good option to use when you are tracking interval from the perspective of performance.
Here is one of the good articles by @Piwai talking about different clock APIs and their underhood implementations.
Observing wall clock time first can be a trigger point to identify if a regression has occurred in your interaction or not. If wall clock time for a cold start or rendering a screen has increased you will know that there is some regression that has entered in your flows.
On CPU time
On CPU time is a quantification for your CPU usage. It is the total time when your process or thread are scheduled to execute the code on the CPU.
This can also be described at a process or a thread level. It is very important to select the right level for your use case and then extract the CPU time. For example,
- In cases where you are working on rendering time or cold start performance issues, you might only want to look at Main Thread CPU time as it is responsible for drawing your UI.
- In cases where you are working on some battery-related performance issue and you want to measure CPU contribution on battery drain, looking at process CPU time still makes sense to calculate CPU usage contributed by your app process.
Why care about On CPU time?
CPU time is important to surface the regressions which spend most of the time on the CPU like object allocations, expensive calculations. Let's see when to note this value and what could be actionable that we can get:
- Let's say in one of your releases wall clock time for a screen rendering increased then according to the discussion in the previous section you know there is definite regression.
- Further comparing main thread CPU time you would know that there could be some On CPU regression that has entered your interaction or not. In these cases, the regressions could be object allocations, expensive calculations, anything which can have overhead on the CPU.
- The next step would be to collect the method trace from Debug method tracing API or any of your profilers to mitigate the regression by mostly removing the redundant work or offloading heavy tasks to a background thread.
Where to get On CPU time from?
CPU time consists of two kinds of values:
- User CPU Time: Time spent scheduled in user mode, that is for executing our app code.
- System CPU Time: Time spent scheduled in kernel mode, that is for executing privileged system calls.
In android, you can get the CPU time in the following ways:
- getrusage API: This struct API can help you to get the CPU time of the app process or thread, based on a parameter value passed in the function
getrusage. The parameter RUSAGE_SELF will return values for the whole process and RUSAGE_THREAD will return values for the calling thread, that is, the thread from where this function is called. - Proc file system: Proc file system is a virtual file system in Linux which can provide you the information about processes and threads currently running on the system. For getting the main thread CPU time we can get these values from the
statfile of the main thread ID.
You can look at the detailed description of the usage of the above APIs in this playground repository. The readme explains the usage and the also discusses pros and cons of the above approaches.
The perspective of CPU time
There could be several confusions on CPU time if you study this from the hardware perspective. The reason is the stalled CPU cycles which can take place even when you are doing some CPU-bound tasks like object allocations on the main thread or any operation which does extensive work on the CPU.
We don't expect the CPU to be stalled when we are doing any CPU-bound operations.
These stalled cycles are a result of memory access latency, changing CPU frequencies (overclock/underclock), etc.
There are primarily two reasons to ignore these metrics when we are calculating performance on any application or software:
- There are no Linux/android APIs that return these values related to hardware.
- The CPU time we obtain from Proc files or
getrusageAPI time is a good approximation to optimize the code paths in your application. They are actually the "scheduled" time when the thread was on core, expected to execute your code.
There is only one tool simpleperf which can tell you about the hardware-related metrics like CPU cycles, instructions executed, frequency, etc. on android.
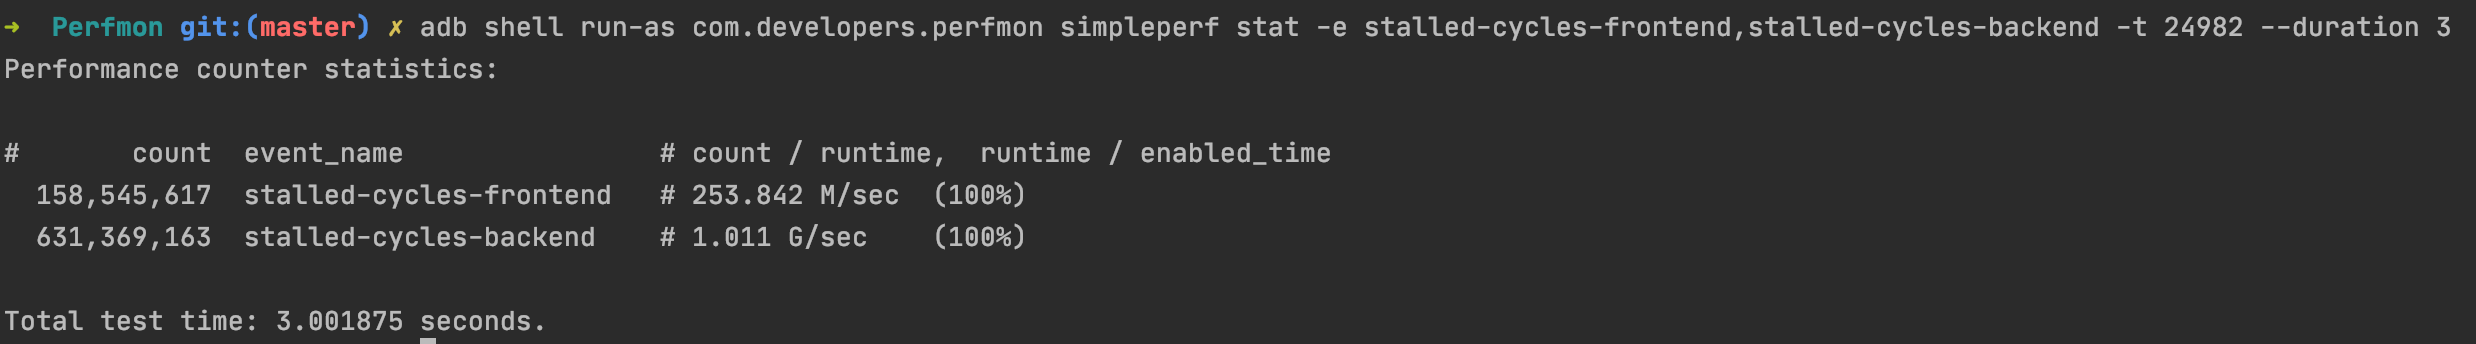
The same tool also exposes something called as stalled-cycles-frontend and stalled-cycles-backend which are the waste CPU cycles in the CPU pipeline. You can run the following simpleperf tool command to get these values:
adb shell run-as com.developers.perfmon simpleperf stat -e stalled-cycles-frontend,stalled-cycles-backend -t 24982 --duration 3Here -t refers that profiling is done for thread and 22600 is the main thread id.
You will observe that even CPU bound operations like calculations, object allocations are returning non zero values stalled cycles:
So, IMO the definition of CPU time can only be defined contextually with the perspective of either hardware or software.
Here is one of the wonderful answers which I have found that has also addressed my confusion, thanks to BurntBrunch.
Time paradox in the CPU world
CPU time is one of the strange metrics in terms of respecting the normal time as it can even get larger than the wall clock time. At first, when I started observing these types of values I was confused about how the CPU time could increase the values of wall clock time.
But then I realized that in the case of multithreaded functions the process CPU time can get bigger than the wall clock time as threads can run parallelly on different cores.
Imagine if there is an initialization that partly does something on the main thread and then on the background thread. So, in a multicore processor, there could be a possibility where these could run parallelly in different CPUs, which means that in an interval of 1 second of wall clock time there could be multiple elapsed ticks for the different CPUs.
So as a result, 1 second could consist of the sum of multiple CPU times coming from different CPUs that could be greater than 1 second.
Off CPU time
Off CPU time is a metric that can help you tell about the wait time for a thread or process. This consists of time spent in I/O, waiting for a lock, or waiting for some blocked resource.
Why care about Off CPU time?
Off CPU time is important to surface the regressions which spend most of the time waiting for the operations like I/O, waiting for locks, or resources. Let's see when to note this value and what could be actionable that we can get:
- After detecting the regression from the increase of wall clock time.
- Comparing the main thread off CPU time you could know that if there are any off CPU regressions or not.
- The next step would be to collect the method trace from Debug method tracing API or any of your profilers to mitigate the regression by removing the I/O from the main thread or resolving the lock problems, etc.
Where to get Off CPU time from?
You can get the off CPU time after knowing about the wall clock time and CPU time. So, for example, if you have wall clock time and CPU time from main thread total off CPU time ideally would be:
Off CPU time = Wall Clock time - On CPU time
Solving Off CPU regressions
Although there are some values returned by the Proc file system which can tell you about the time spent in I/O for the main thread. Apart from I/O, there is no defined APIs to tell you about time spent blocking due to some resource or locks. In my past experience, most of the off CPU regressions are easier to surface in method traces which you can generate from Debug API and visualize them as a flame graph in android studio.
Conclusion
These three types of time are something that I always prefer to observe as an overview before deep-diving into the method traces to catch the issues. This will always give you an advantage as you will know that what to watch out for whenever you are going through the method trace of the user interaction.
Do you guys use these values while solving for performance? What other values do you watch out for other than these times? Reach out to me @droid_singh and let me know.